The 7 Data Analyst Skills You Need in 2023

Businesses rely on data to assist in critical decision-making and to guide organizational strategy. As such, data analysts play a crucial role for organizations across the globe. Data analysts focus on gathering data, maintaining databases, cleaning data, interpreting data, and presenting findings to others. Data analysts work across a variety of industries, including banking, financial services, healthcare, retail, and government. 

Job prospects for data analysts are strong and are expected to continue growth in the future — so, learning data analysis skills is a smart way to fuel a career change or jump-start your current career. 

Working as a data analyst requires a strong skill set involving mathematics, algorithms, software, and specific data-focused applications. In this guide, we’ll discuss the skills data analysts need to get started in the industry. 

If you’re interested in learning more about becoming a data analyst, Northwestern Data Science and Visualization Boot Camp is a great place to start. This part-time, 24-week boot camp can help you advance your data science career and learn essential skills for data analysts. 

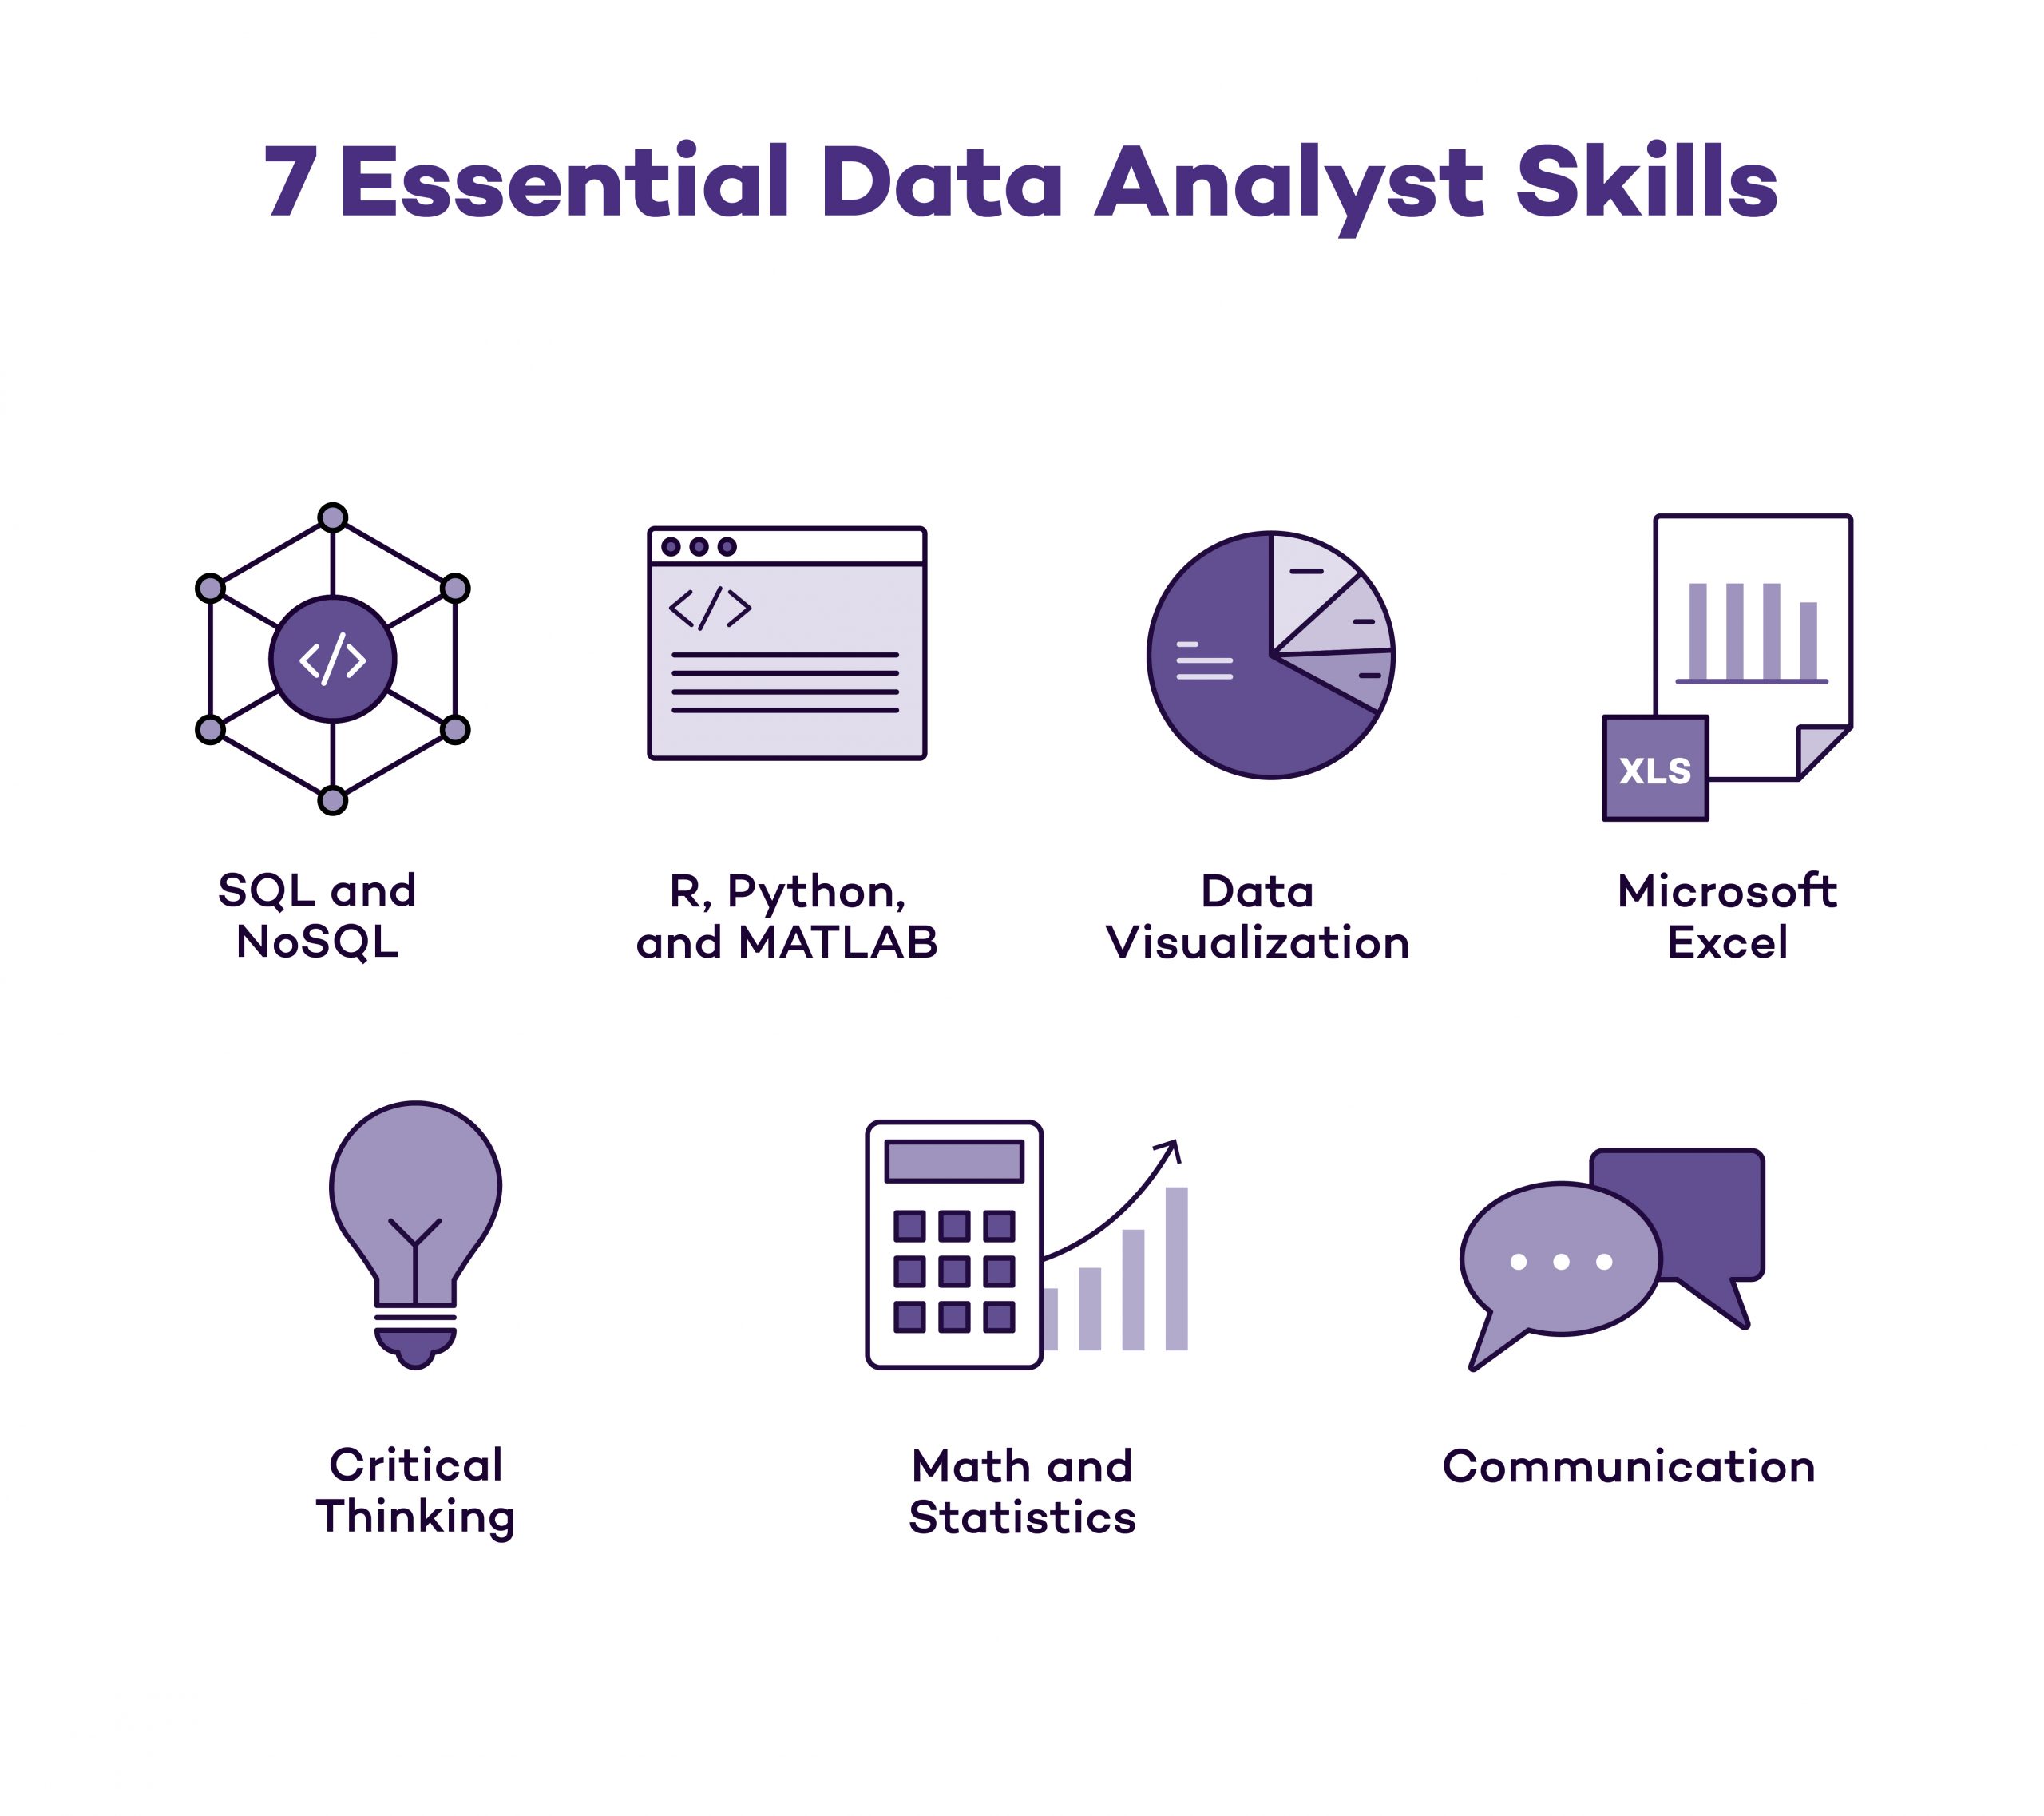
Below, we’ve listed seven skills that are an important part of data analyst qualifications.

1. SQL and NoSQL

SQL (Structured Query Language) and NoSQL (Non-SQL or Not Only SQL) are programming languages that excel at manipulating and querying data. They’re widely used across many functional areas, and data analysts often need to know one or both of these languages depending on their role and the type of data they’re working with. 

SQL is used when working with structured databases. Structured data is presented in a standard format and structure — and it generally follows a model. Some examples of structured data include dates, phone numbers, addresses, and names. Structured data is often used in CRM (customer relationship management) systems, ERP (enterprise resource planning) systems, or inventory management systems. SQL Server Data Tools (SSDT) can also be used to build relational databases with the software.

Unstructured data has no predefined data model, making it more difficult to search. Examples of unstructured data include images, sounds, photos, or strings of text; and it can be found in applications like email, text editing software, or media creation software. NoSQL is used to query databases of unstructured data.

Both languages have their place, depending on which kinds of data an analyst is working with. When comparing SQL software with NoSQL, NoSQL is generally considered a stronger tool because of the types of data it can manipulate. While these languages are relatively old, they are not obsolete — knowing how to query and manage data using SQL and NoSQL is critical for any data analyst. 

2. R, Python, and MATLAB

Data analysts often have to manage and analyze large, complex data sets beyond what simple spreadsheets or other consumer-focused programs can process. There are many programming languages and statistical modeling languages available, and the best language for a specific analyst depends on the field and the type of data being analyzed. Some of the most common languages in this category include R, Python, and MATLAB.

R is a language developed with statistical computing and data visualization in mind. It provides a large library of statistical and graphical-focused modeling techniques that allow an analyst to find patterns or trends within a data set. MATLAB is a programming platform tuned for software engineers and data scientists, allowing for data analysis and the creation of algorithms. MATLAB is used across various fields, including machine learning, image processing, finance, biology, and academia. 

Python is a general-purpose programming language frequently used to analyze data. It’s a widely used language with a vast selection of libraries for various functions. NumPy is one of many popular Python libraries used for analyzing data, though the best library for an individual analyst depends on their field of practice.

Data analysts often use languages like R, Python, and MATLAB to implement algorithms for specialized data analysis. Learning the basics of one (or more) of these languages, and their associated data-focused libraries, can help propel your career as a data analyst.

Get Program Info

Back
Back
Back
Back
Back
Back
Back
Back
Back
0%

Step 1 of 6

3. Data Visualization

Humans are often visual learners. As a result, visualizing a data set is the most effective way to convey information rather than verbally explaining trends or providing a spreadsheet. Bar charts, line charts, scatter plots, maps, or other data visualizations can provide a quick, easy way to understand trends found within a data set. Getting the most out of data visualization software requires an understanding of statistics, programming languages, and knowledge of when to use specific types of plots. As a data analyst, it’s also important to be familiar with at least one of the major data visualization tools commonly used in the marketplace. 

There are a variety of data visualization tools used in a variety of fields. Some of the most popular include Tableau, Microsoft Power BI, QlikView, Plotly, and D3.js. What you’ll find is that the more expensive options require less coding ability, where the open-source options require coding skills to operate them effectively.

Regardless of the tool, data visualization can help showcase trends in data in an effective visual manner. One great example of this is the scatter plot, sometimes referred to as a scatter chart or scatter graph. These visualizations use dots to represent values for different numeric variables on a vertical and horizontal axis. This powerful tool can be used to observe relationships between variables. For example, a data analyst could chart the age of a company’s customer base vs. the average lifetime spend per user — finding any kind of relationship between the two could help the organization understand which demographics are the best to target. 

4. Microsoft Excel

Excel offers data visualization tools used to create charts and graphs for the data found within spreadsheets. While not as powerful as those found in specialized applications like Tableau, it’s easy to build data visualizations to showcase trends or highlight takeaways from data sets. Understanding Microsoft Excel functions is important for anyone looking to enter the data analysis field. 

Data analysts often use advanced Microsoft Excel formulas. The Microsoft Office suite of products has its own coding language called Visual Basic for Applications (VBA). This language is used to perform advanced data analysis tasks, automate functions, and much more. Microsoft offers VBA documentation and resources for anyone interested in learning more about the language and its functionality. 

Learning how to use Excel is a great starting point for anyone interested in becoming a data analyst. It’s an incredibly flexible and powerful program with applications for business, data analysis, science, and beyond. 

If you’re interested in learning more about spreadsheets, but don’t currently have an Excel license, one free Excel alternative is Apache OpenOffice — their Calc spreadsheet tool provides similar functionality for free. 

 5. Critical Thinking

Critical thinking refers to the intentional application of logical thought processes, such as information gathering and synthesis, problem recognition, and recommendations, to reach a course of action or solution given available information. Thinking critically and understanding data is important for any data analyst, and are core skills. In fact, continually assessing and reassessing incoming data is a hallmark of a great data analyst. 

The iterative nature of data analysis enables analysts to build their critical thinking skills on the job, too. For example, such projects as consumer trend evolution monitoring, or consumer trend projection, require the ongoing application of critical thinking skills to keep decision makers updated and informed.

Interested in developing your critical thinking skills further? Consider these online courses to help you develop your abilities.

6. Math and Statistics

Math and statistical concepts are necessary skills for any data analyst. Linear algebra is crucial, as it is a large component of creating and modifying data-crunching algorithms. Calculus is another important skill that data scientists and advanced data analysts should understand as well. 

Statistics is especially important for data analysts, as an understanding of all the possible statistical methods that could help analyze a data set is central to their work. In addition, knowing the best statistical methodology to approach each project will help them work through data sets more quickly and efficiently. 

If you don’t have a math-heavy background, or it’s been a while since you took your last mathematics or statistics class, there are options to help you brush up on key concepts. One great resource is edX. Free and low-cost online courses are available in various levels of algebra, pre-calculus, and calculus. Online statistics classes are also available.

7. Communication

Communication is important for any position, but it’s especially important in data analysis roles. Knowing how to analyze and interpret data is essential, but the analysis is worthless if findings aren’t effectively communicated to key stakeholders within an organization. Data analysts deploy a mix of analytical math-focused skills and strong communication skills to help businesses make data-driven decisions. 

Public speaking and presentation skills are important for data analysts. Often, analysts will report their findings to a wider team or key decision makers within an organization in meetings. The information conveyed will be used to make important business decisions, so communicating clearly and concisely is crucial in these settings. For those who are not well-versed in effective public speaking, there are online public speaking courses available to help hone your skills in this area as well.

In addition to the data visualization and verbal communication skills data analysts must possess, written communication skills are also essential for data analysts. Written reports and communicating advanced mathematical and statistical concepts are often distributed to a broader audience of decision makers — many of whom will not have the same mathematical and statistical skills as the analyst. For this reason, it’s important for data analysts to have the ability to translate advanced concepts into easily digestible content. Many analysts enroll in business writing courses as part of their ongoing professional development to continue building their skill sets and helping them advance in their careers.

Where to Start

Data analysis skills are very in-demand at the moment and, as such, there are many places where you can learn more about becoming a data analyst. One of the best ways to build data analysis skills is through a data science boot camp. Northwestern Data Science and Visualization Boot Camp is a part-time, 24-week program that teaches a wide range of data science skills, including data modeling and forecasting, essential database skills, Python programming, business intelligence software usage (e.g., Tableau), and advanced topics such as machine learning. In addition, you’ll reinforce all these skills as you complete real-world projects that you can show future employers in your professional portfolio. 

In addition to being an exciting and in-demand career, data analyst role salaries are lucrative. In fact, according to Burning Glass Technologies, the median data analyst salary in the U.S. is $73,279, which is greater than the median wage for all occupations. Even better, demand for data analysts is projected to grow by12.3 percent in the next decade.

Data Analyst Skills FAQs

Here are answers to some of the most frequently asked questions about how to get into the data analysis field.

Do I need a data analyst degree to get a job?

Having a degree might be preferred for some positions, but the most compelling factor for employers seeking data analysts appears to be your experience and skill set. Completing a data science and visualization boot camp can help you gain the skills to advance in your current career, or transition into a new one.

To learn more, read about this student’s journey to a new career path via Northwestern Data Science and Visualization Boot Camp.

Is SQL hard to learn?

SQL is generally easy to learn, as its syntax is relatively close to English. In addition, this language has been around for a long time, so there are many resources to help you get started with SQL. 

If you’re interested in learning more about SQL beyond online SQL tutorials, completing a data-focused boot camp like Northwestern Data Science and Visualization Boot Camp can help you learn this essential database language in the context of a data analyst’s real-world projects and activities. 

Is Python easy to learn?

Data analysts work with vast amounts of data that often require complex algorithms and programming languages to analyze. Python is one of the most popular programming languages for data analysts and is considered one of the more accessible programming languages for a new programmer. Python is a prevalent programming language with extensive developer documentation, including a Python for Beginners page on the Python website. As with any programming language, building applications and algorithms is one of the best ways to learn. 

Data analyst vs. data scientist: What’s the difference? 

Data analysts often work with structured data to solve more fundamental problems for a business or organization. In comparison, data scientists build algorithms and use machine learning techniques to make predictions or automate data collection and analysis tasks for unstructured data sets. Both paths are a good option for those interested in advanced math, statistics, and machine learning. 

Get Program Info

Back
Back
Back
Back
Back
Back
Back
Back
Back
0%

Step 1 of 6