8 Types of Data Analysis

If you’re interested in pursuing a career in data science, gaining a deeper understanding of how to distill data down using different methods is key; data analysis is fundamental to just about any business and industry. Companies rely on the data they collect to inform future business decisions, so understanding different types of data analysis and how they work in tandem is a fundamental skill set in any data professional’s toolbox.

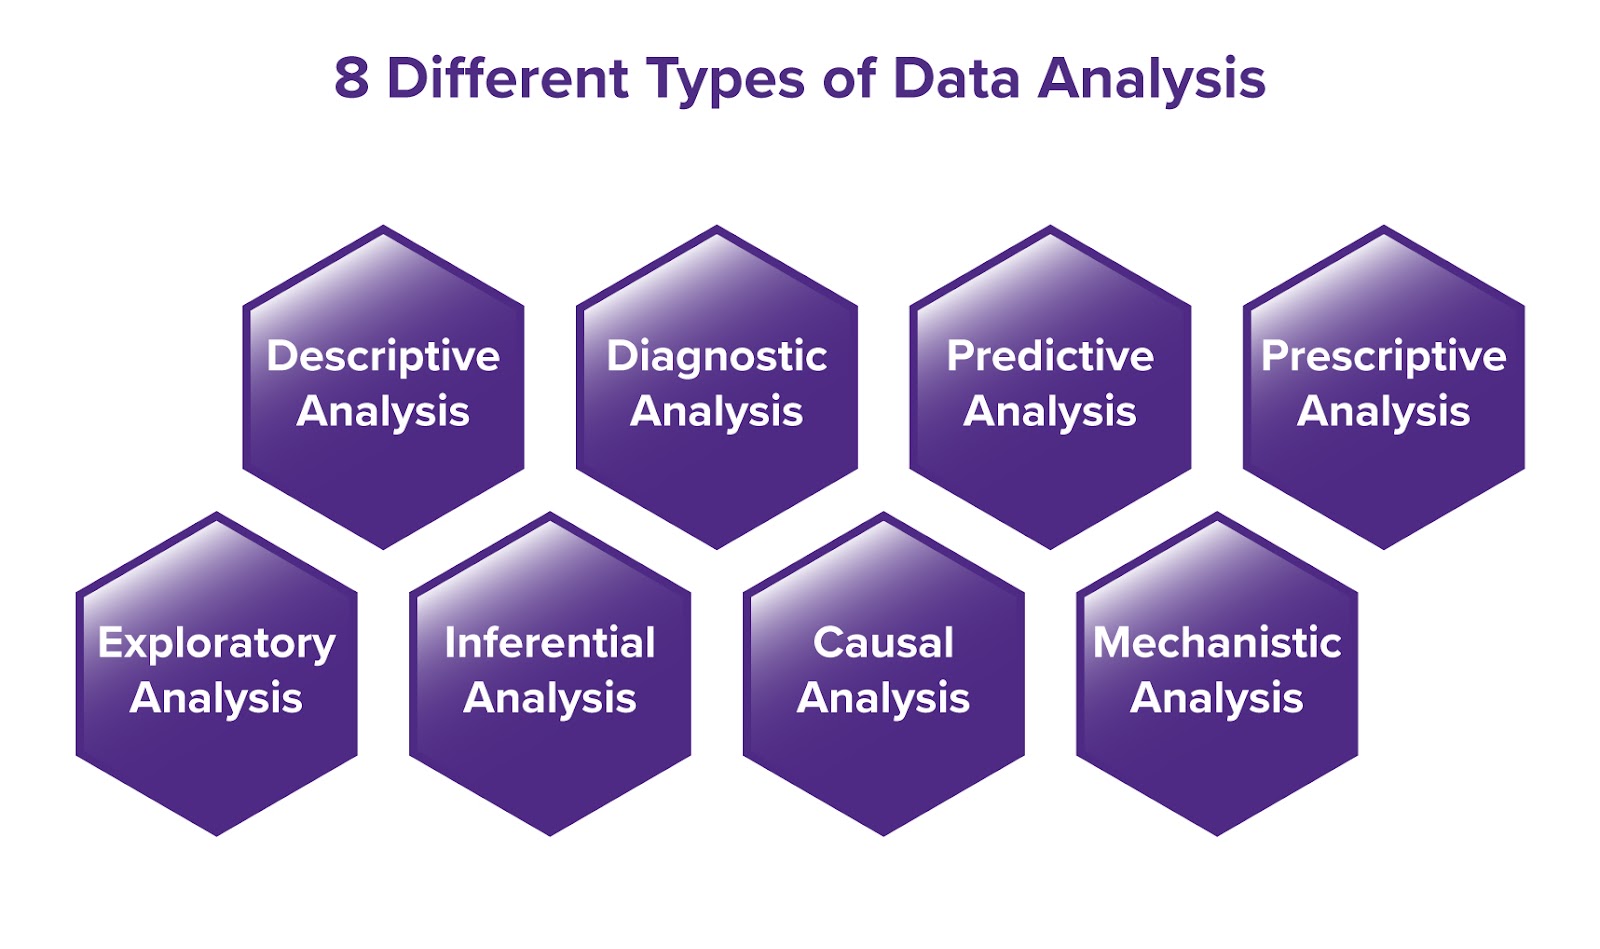
In this article, we will discuss eight key types of data analysis that are prevalent across the data science industry. If you’re pursuing work in an industry where data is critical to the company’s success, or want to enter a new field in competitive arenas like government, healthcare, or media, having a working knowledge of these core data analysis techniques will help give you an edge.

Are you currently working as a data professional, but want to advance your career by acquiring new skills within data analysis? Do you want to branch out into a different type of data analysis altogether, like working with data that uncovers social or consumer needs? Understanding how to use the below eight types of data analysis will give you an advantage within the field.

Organizations across a variety of industries rely on data analysts in order to identify trends and patterns, uncover insights, and drive business decisions; and the individuals responsible for collecting, sorting, and analyzing that data will continue to be in-demand as more data is created each day. From Netflix’s recommendation system driven by user data, to data-enabled technologies that help restaurants manage their inventory, to medical systems used to track public health issues, there is no shortage of ways aspiring data analysts can apply their knowledge in today’s workforce.

Having a strong understanding of data analysis techniques doesn’t necessarily mean enrolling in a more formal higher education program. Enrolling in a data science boot camp can get you up to speed on the methods of data analysis used by professionals to solve a variety of real-world business problems in just 24 weeks. Northwestern Data Science and Visualization Boot Camp gives individuals a deeper understanding of how different types of data analysis are used by professionals in the industry.

8 Different Types of Data Analysis

Working as a data analyst professional means analyzing data through a pipeline and working with different types of data analysis. While the types of data analysis methods are different, they all relate to one another and work together to allow data professionals to have a robust understanding of how data impacts a business’s bottom line.

Descriptive analysis serves as the foundation of data insight and informs what happened within the data. Diagnostic analysis looks at why the data happened, while predictive analysis questions what will happen. Prescriptive analysis measures what action should be taken. Exploratory analysis is a data mining approach that determines characteristics of data sets, and inferential analysis draws conclusions about data trends. Causal analysis measures cause and effect, and mechanistic analysis distills changes in variables that cause changes to other variables.

We explore each data analysis type more in the sections below.

Get Program Info

Back
Back
Back
Back
Back
Back
Back
Back
Back
0%

Step 1 of 6

Descriptive Analysis

Descriptive data analysis is often referenced as the foundation of all data analysis; it is the most common type of data analysis used by organizations. Descriptive analysis focuses on analyzing past data to describe what happened in certain events and situations.

Looking at historical performance in this way gives companies the opportunity to evaluate what happened in the past, and use this data to inform future applications. Descriptive analysis is often used in presentations to describe business outcomes to important stakeholders. Key performance indicators (KPIs) are a common example of a descriptive analysis metric. Return on investment (ROI) is another metric used in descriptive analysis.

Descriptive analysis usually involves the use of data dashboards. Google Analytics is one commonly used tool for conducting descriptive analysis. When creating a presentation based on descriptive analysis in research, data professionals seek to tell a story using metrics. For example, identifying deviations, calculating frequencies and percentages, and showcasing them in a cohesive way that helps companies understand how certain areas of their business are performing. Depending on the industry you’re working in, performing a descriptive analysis can mean working with percentages, revenue, page views, and even first- or third-party data.

Diagnostic Analysis

If descriptive analysis tells the story of what happened, diagnostic analysis takes things a step further and seeks to answer why it happened. Techniques used in diagnostic analysis utilize the findings in descriptive analysis to dig deeper into the metrics and pinpoint what caused the data to present the way that it did.

Diagnostic analytics zeroes in on anomalies within descriptive analysis and seeks to make sense of unexpected changes or shifts in a metric that were outliers from the rest of the data collected within a set. During diagnostic analysis, all collected relevant data helps make sense of what occurred to cause this shift. From there, data professionals use statistical techniques to identify trends that can explain the anomaly.

Diagnostic analysis is important to businesses because it enables professionals to make sense and gain an understanding of what happened within a data set, providing answers and a framework for what to do in the future. Diagnostic analysis is looked at as problem-solving analysis. However, diagnostic analysis cannot be performed unless robust descriptive analysis has been conducted. Diagnostic analysis can only be successful and helpful to professionals if descriptive analysis has been done effectively, which is important to keep in mind when working as a data professional.

Predictive Analysis

Descriptive analysis showed us what happened, and diagnostic analysis gave us a better understanding of why it happened. Now, it’s time to take this knowledge and leverage it to determine what may happen in the future. That’s where predictive analysis comes in.

Using descriptive analysis and diagnostic analysis as a framework, predictive analysis answers pertinent questions for businesses about what may happen in the future. Predictive analysis models you may work with to gain an understanding of this are decision trees. This support tool creates a tree-like model to showcase decisions alongside potential outcomes; neural networks, computing systems that mimic user behavior of the data being analyzed; and regression analysis, a predictive modeling tool that estimates relationships between variables.

While not always the case, predictive analysis is often used when a business is experiencing difficulty and needs to be able to look into potential outcomes with relative certainty. Types of predictive analysis models that help businesses overcome possible issues are sales forecasting and risk assessment. Predictive analysis can also be used to help customer success teams inform their approach.

Though predictive analysis isn’t always a sure bet, the success rate of predicting outcomes across different business sectors is most accurate when a robust set of data is being used to inform patterns and predictions.

Prescriptive Analysis

Predictive analysis shows what will happen, then prescriptive analytics tells the story of how it will happen. For this reason, prescriptive analysis is considered one of the most powerful data analytics models. Prescriptive analysis relies heavily on the information found in the predictive analysis phase. Leveraging the predicted outcomes, prescriptive analysis builds an actionable game plan that businesses can utilize and use to their benefit once they understand what will happen.

Conducting prescriptive analysis relies on machine learning strategies. These strategies pinpoint repetitions in data sets, which calculates different outcomes. Prescriptive analysis can inform data strategies for many facets of business, including HR, the customer experience, finance, marketing, and logistical analytics.

Prescriptive analysis takes every possible outcome, then formulates a strategy to follow that’s predicted to be the most successful path forward. When presenting a prescriptive model, the best path might not always be clear to the data professional. The course of action that’s most desirable largely depends on the company’s overall goals and what the most important outcome is above all else.

Google Maps is one example of prescriptive analysis at work. This technology will calculate all of the modes of transportation available to get you to point A to point B. Though the fastest route is often the most popular choice, users who would rather take a route with fewer turns or without tolls have other options to choose from — the same way businesses using prescriptive analysis can choose what path makes the most sense for the company objective.

Exploratory Analysis

Exploratory analysis — sometimes referred to as EDA — looks at data sets to better understand how to get the answers needed from the available data. The process for exploratory analysis typically involves investigating characteristics within data sets to see what else they reveal.

Exploratory analysis offers an opportunity to look at the data and ensure accuracy, distill patterns, zero in on interesting relationships within data sets, and detect outliers. Exploratory analysis is often thought of as a more sophisticated analysis, as it’s more malleable and can help inform the questions being asked by company stakeholders, rather than the other way around.

Exploratory analysis can happen early on in the data analysis pipeline, or it can be used to dig deeper into already established data sets to evaluate the accuracy of — and answer questions about — variables and deviations.

Data science tools used to conduct exploratory analysis include Python, a programming language that can be used to help detect missing values within data sets, and R, another programming language leveraged by statisticians to conduct data analysis and uncover important EDA statistics.

Inferential Analysis

Inferential analysis takes the work done in descriptive analysis and draws conclusions from it. Work done during inferential analysis often seeks to identify relationships between different data points, drawing conclusions on a certain data set or population segment based on the data collected in the descriptive analysis phase.

Inferential analysis is helpful for businesses looking to test out a certain theory or hypothesis. For example, A/B testing can be created based on the work done through inferential analysis. This kind of data mining can be leveraged as a starting point based on the inferences made to either prove or disprove these theories.

When conducting inferential analysis, tools used include a linear regression analysis — an X and Y scale used to measure the relationship between two variables. Correlation analysis may also be conducted, which puts the extent to which two variables are connected to one another to the test using a scaled approach.

Causal Analysis

Causal analysis focuses on analyzing the cause and effect of related variables within data sets. These relationships can either be discovered through previous data analysis, or they can be relationships that could potentially be either beneficial or harmful to a company’s desired outcome. Causal analysis can often be conducted during the course of an experiment, where the data professional works with outcomes from a certain theory being tested.

For example, causal analysis can be conducted in drug studies to measure the efficacy of a drug on a person’s condition, or to determine if a type of ad campaign is effective in influencing a person’s purchase decision.

Causal analysis can be used to disprove causation within related sets of data as well. Just because data sets are correlated with one another does not necessarily mean that one caused the other, or vice versa. In instances where businesses need to better understand whether or not cause and effect exist within correlated data, causal analysis is a helpful tool.

Mechanistic Analysis

Mechanistic analysis is used to understand exact changes in data that occur from exact changes in other data. Mechanistic analysis is used in scenarios where the margin for error needs to be at or close to zero. It’s a very precise way of evaluating data and understanding the relationship between how data from one set impacts the other.

Mechanistic analysis is a popular form of analysis used in the medical industry for this reason. When testing the efficacy of a medical device, mechanistic analysis can be used to measure the machine’s output along with the effect it has on the patient it’s being used on. This analysis method has helped inform new treatment methods within the medical field and led to scientific advancements.

If you’re interested in pursuing a career in science or health care, understanding mechanistic analysis and how to conduct it effectively will give you an edge.

An image that shows different types of data analysis.

Learn Data Analysis Today

Now that you understand 8 common types of data analysis, it’s time to start putting these techniques into practice.

What’s the most effective way to learn data analysis, you may ask? Taking a data science boot camp can help you gain a deeper understanding of data analysis techniques and allow you to learn how these important data analysis methods are put into action across a wide variety of industries. Check out Northwestern’s Data Science and Visualization Boot Camp to take a closer look into our curriculum, what you’ll learn, and how a data science boot camp can easily complement your current work or study schedule.

Types of Data Analysis FAQs

Data analysis helps business leaders make informed decisions, helps companies reduce costs, and allows businesses to target potential customers more strategically. Here are a few more types of data analysis FAQs you may be curious to know more about.

Data analysis happens in five key stages. Data is identified using measurement tools, then collected within these platforms. Data is cleaned and prepped for analysis, removing errors and distilling it into an easy-to-understand format. Data is then analyzed using tools and techniques and finally interpreted by a data professional.

Data analysis is used by researchers to make their jobs easier, providing them with key data patterns, statistics, and outcomes that they can use to inform their research strategy. With so much data available to researchers across different industries today, working with a data professional who can sift through data sets and provide researchers with varied forms of analysis can be critical to success in these fields.

Advanced analytics is the umbrella term for analysis that uses automation and artificial intelligence (AI) to delve into data sets and generate deeper insights. Predictive analytics falls under the category of advanced analytics as it uses machine learning to identify patterns and make predictions regarding outcomes.

An image that features data analysis FAQs with the answers that are shared in the article.

Summary

Data analysis is one of the most important disciplines that exists in the working economy today. Having professionals who are able to analyze and distill data, then generate meaningful insights and actionable patterns from these data sets, are critical to the success of businesses across just about every industry.

If you’re interested in pursuing a career in data analytics, enrolling in data science boot camp is an effective way to set yourself apart from others, gain a deeper understanding of the different types of data analysis, and get hands-on practice using real-world scenarios.

Get Program Info

Back
Back
Back
Back
Back
Back
Back
Back
Back
0%

Step 1 of 6